
The bears have entirely dominated the market since early April. The support at $1,000 has stopped Ethereum from further correction over the last seven days. The question is whether a rally is possible in the short term or not?
Technical Analysis
By Grizzly
The Daily Chart
The descending line (in yellow) has accompanied the RSI 14D indicator for a long time. This line has acted as resistance most of the time and has not been broken up until now – except once in March 2022. Since the beginning of April, when this index has fallen below the mentioned line again, the market has experienced a continuous bearish phase.
Currently, this indicator is struggling with the descending line (in red). If it breaks to the upside, this could also put a halt to the bearish momentum for the short term. If that’s the case, the price movement towards the horizontal resistance at $1,700 would be a potential outcome. Moreover, if the bulls manage to push the price above $1700, then the reversal of the trend will be confirmed.

Key Support Levels: $1000 & $900
Key Resistance Levels: $1300 & $1500
Moving Averages:
MA20: $1122
MA50: $1499
MA100: $2188
MA200: $2619
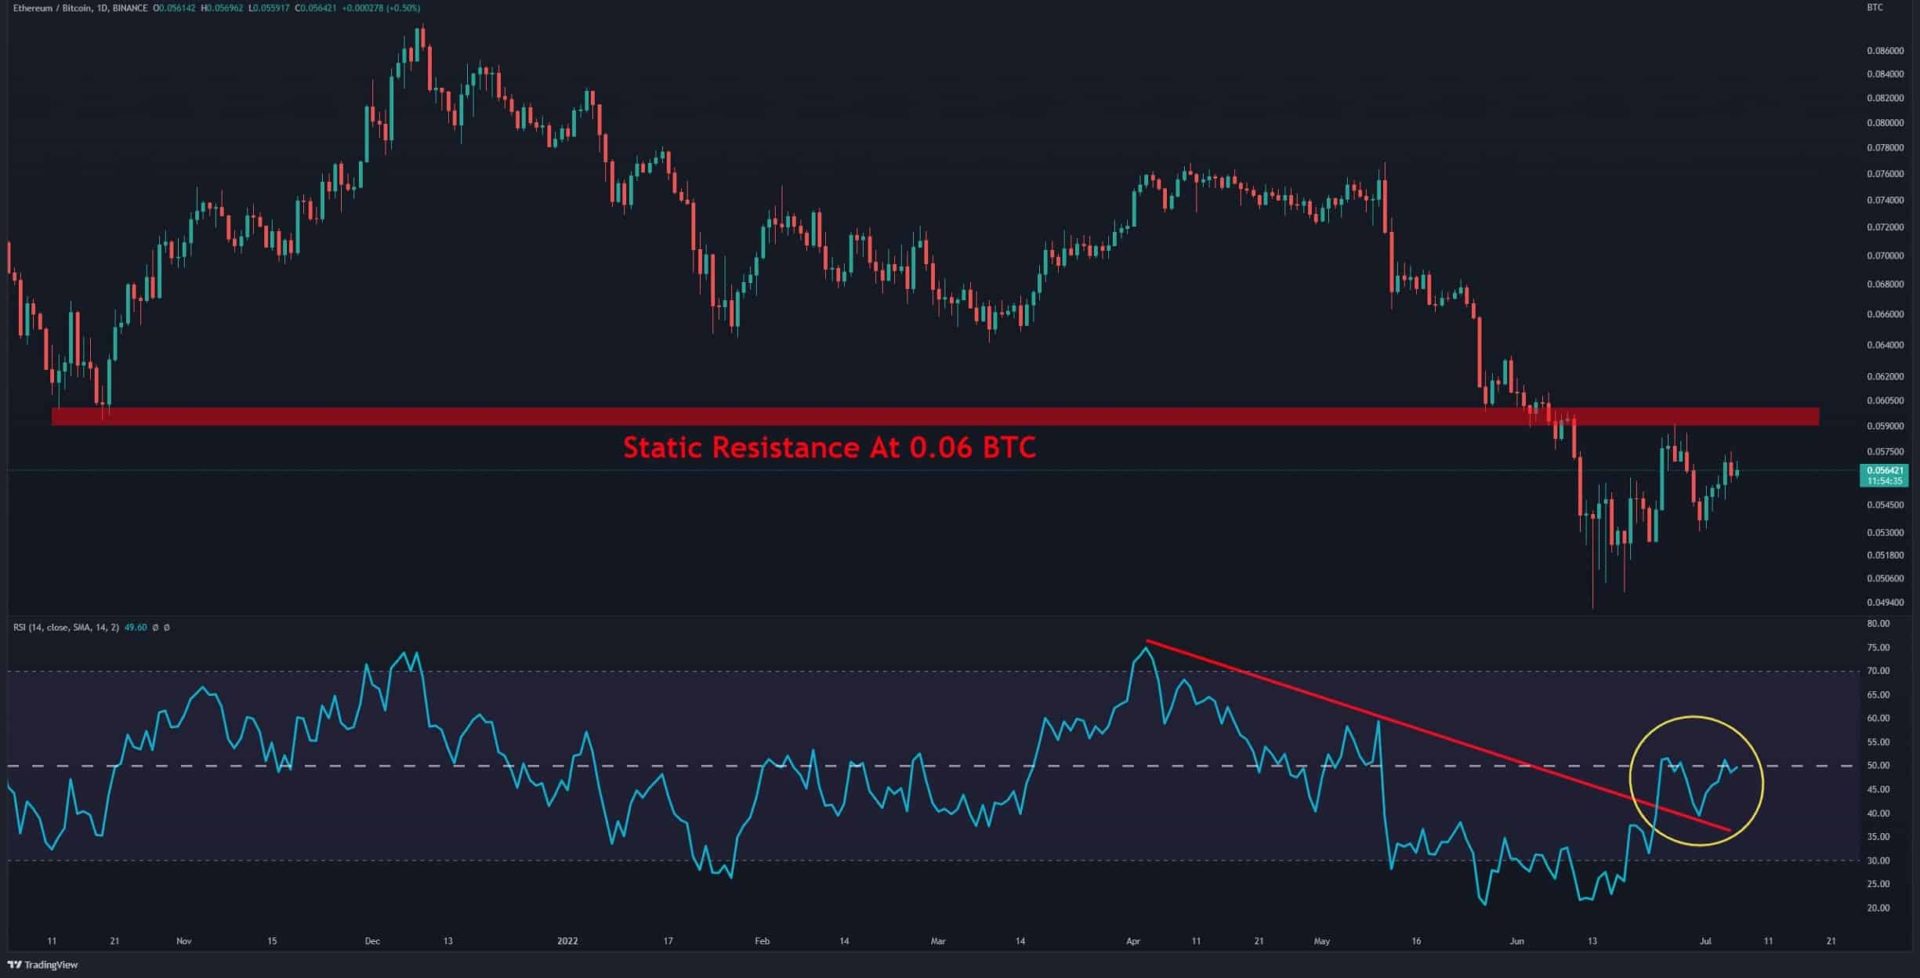
The ETH/BTC Chart
Against BTC, the descending line (in red) in the RSI 14D indicator has broken upwards, and the index is moving towards the baseline after the pullback. If the RSI can gain momentum above its baseline, it can be expected that Ethereum will perform better than Bitcoin in the coming days. The critical resistance level on this chart is at 0.06 BTC.
On-chain Analysis
Exchange Reserves – Derivative Exchanges
Definition: The total number of coins held on exchanges.
As the values continue to rise in reserve, it indicates higher selling pressure. For derivative exchange, since coins could be used to open both long/short, a rise in reserve values indicates possible high volatility.
Supply held in the derivatives market has been increasing since April. This is often associated with rising volatility because these funds are most likely used to open both long and short positions.
Binance Free $100 (Exclusive): Use this link to register and receive $100 free and 10% off fees on Binance Futures first month (terms).
PrimeXBT Special Offer: Use this link to register & enter POTATO50 code to receive up to $7,000 on your deposits.
Disclaimer: Information found on CryptoPotato is those of writers quoted. It does not represent the opinions of CryptoPotato on whether to buy, sell, or hold any investments. You are advised to conduct your own research before making any investment decisions. Use provided information at your own risk. See Disclaimer for more information.
Cryptocurrency charts by TradingView.