

As a continuation to its nightmare’s week, Bitcoin dropped another 8% from today’s $35,600 opening price and recorded a current low of $31,700, according to Bitstamp.
The primary cryptocurrency has been in a downtrend since reaching a weekly high of above $41.3K on Tuesday, and so far had seen a drop of 24% in just six days.
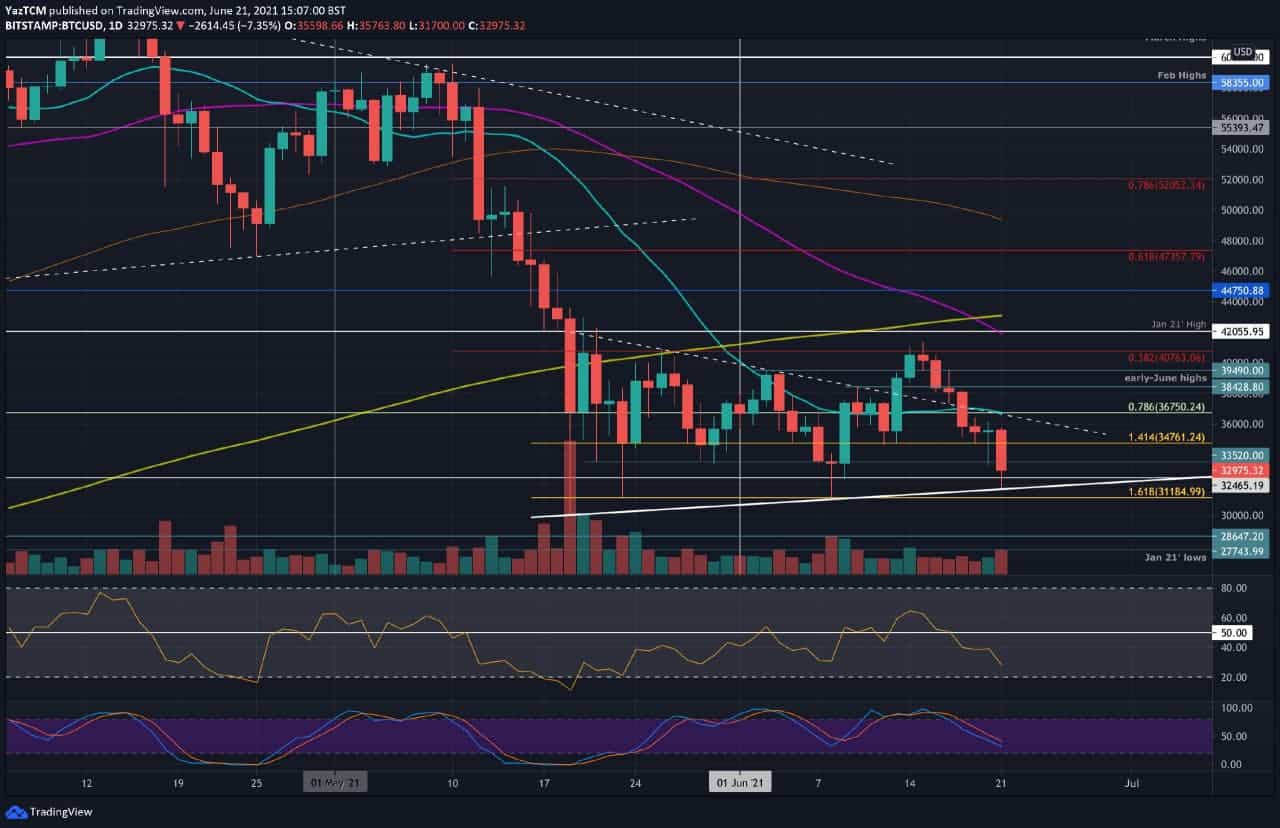
After another Death Cross that took place on Saturday, where the 50-day MA crossed below the 200-day MA, the bulls are now attempting to defend a critical support line around $32K. Failing to close today’s candle above it, could rapidly result in retesting of the lowest BTC price recorded since January – $30K (on May-19).
As can be seen on the following daily chart, today’s current low of $31.7K is an ascending supporting trend-line that was tested on three occasions – May 19, June 8’s low of $31K, and today.
In the short term, as can be seen on the following 4-hour chart, the bears are in full control where bitcoin is trading inside a descending price channel and is currently testing its lower boundary.
Overall, BTC had seen better days, as the nonstop news coming from China, along with a bearish technical event (Death Cross) put a threat upon the ongoing rally of 2021.
One sign that supports the idea of a possible (even temp) correction is the bullish divergence clearly seen on the lower time-frames, such as the 1-hour and 4-hour charts (on the daily chart – subject to today’s close).
BTC Price Support and Resistance Levels to Watch
Key Support Levels: $32,465, $31,700, $31,000, $30,600, $30,000, $28,650.
Key Resistance Levels: $33,520, $34,000, $35,000 $36,750, $38,420.
Looking ahead, the first support lies at current trading levels of around $32K, as mentioned above. This includes today’s current low of $31.7K.

A bit below lies $31K – which is June’s lowest price level. This is followed by $30,600 (downside 1.618 Fib Extension), and $30,000 (lowest since January 2021). Beneath $30K, support is expected at $28,650 and $27,750 (Jan 2021 lows).
On the other side, the first resistance lies at $33,520. This is followed by $34,000 (price channel’s upper angle), $35,000, $36,750 (20-day MA), and $38,420 (early-June highs).
The daily RSI produced a fresh low for June today as the bearish momentum increases. However, as discussed above, the 1 and 4-hour RSI is showing hints of bullish divergence emerging. This might help the market rebound in the short term and help to defend the current $32,460 support.
Bitstamp BTC/USD Daily Chart
Bitstamp BTC/USD 4-Hour Chart
Binance Futures 50 USDT FREE Voucher: Use this link to register & get 10% off fees and 50 USDT when trading 500 USDT (limited offer).
PrimeXBT Special Offer: Use this link to register & enter POTATO50 code to get 50% free bonus on any deposit up to 1 BTC.
Disclaimer: Information found on CryptoPotato is those of writers quoted. It does not represent the opinions of CryptoPotato on whether to buy, sell, or hold any investments. You are advised to conduct your own research before making any investment decisions. Use provided information at your own risk. See Disclaimer for more information.
Cryptocurrency charts by TradingView.