

Bitcoin continues to hold the 21-day, 21-day EMA, and $60K levels which is a near-term positive signal. There has been some profit-taking from the 2-to-3-year and 5-year old coins, but there’s no trend of distribution forming just yet.
Overall, the trend in fundamentals and based on on-chain metrics remains bullish, but we have to remain cautious as the Fed will be making an update on tapering bond purchases.
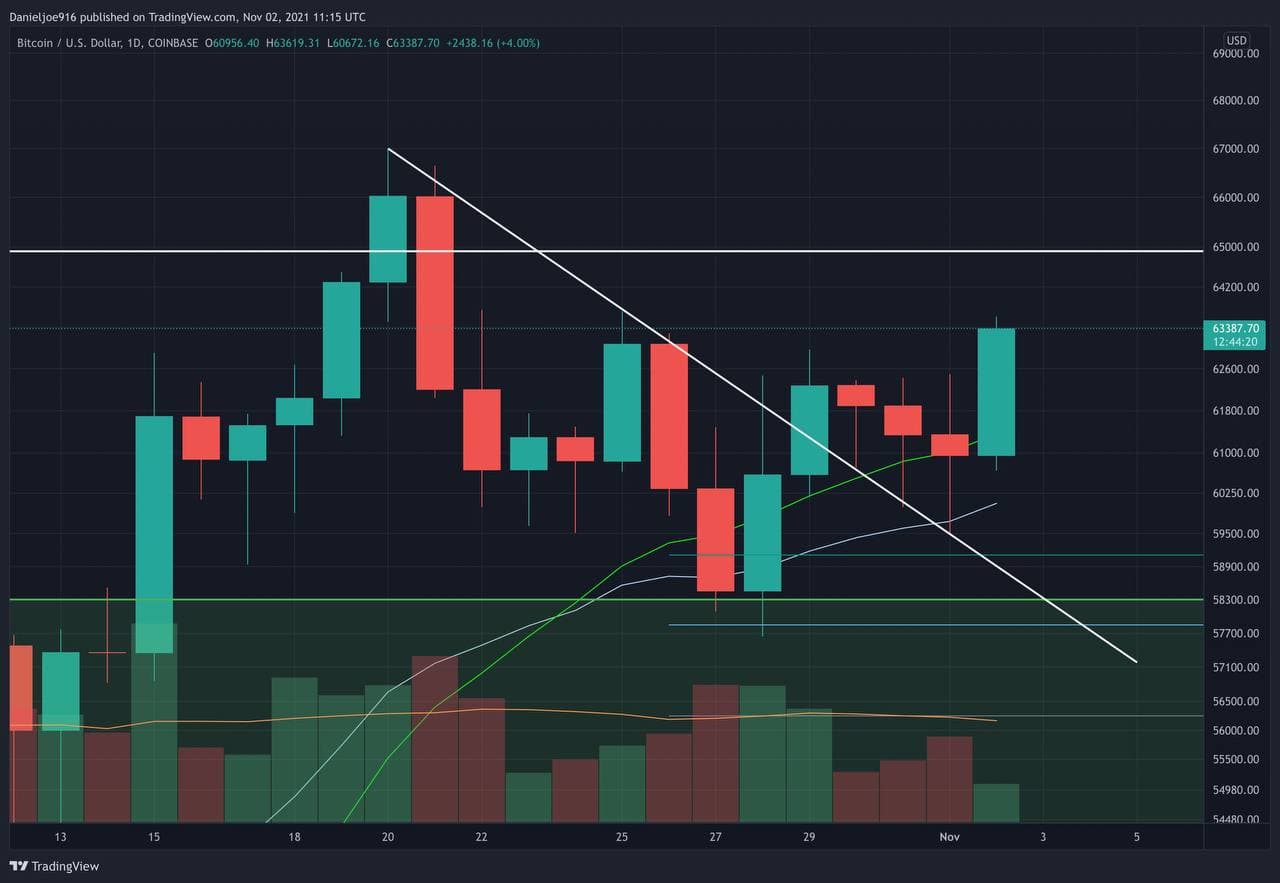
The Technicals
The near-term technicals are slowly improving as $60K continues to hold with a push above the 21-day and the 21-day EMA. We still need to see a push above $63.7K to form a higher high.
We also need to see the weekly close above $64.8K to help drive a larger breakout to new all-time highs. It’s important to watch for the Fed commentary on tapering bond purchases, although it has been hinted at for months – the market can still react negatively, causing an increase in volatility.
If stocks react negatively, this could cause another shakeout for Bitcoin. There’s strong support that remains between $60K to $53K, which is also a strong on-chain demand zone.
The On-Chain
Some light distribution continues to happen on behalf of the 2-to-3 year and 3-to-5-year-old cohorts. All the other groups continue to hold with no major trend of distribution forming as of now.

The Mean Coin Age (MCA) fell slightly but continues to remain near the all-time highs. It’s important to see the older cohorts, in aggregate, continue holding, especially with the near-term shakeout and potential recovery.
Miners continue to hold, which suggests that they expect higher prices. However, the leverage ratio remains at .19, which begs for caution. The last time BTC was trending lower with leverage ratio trending higher, we saw a massive short liquidation, sending BTC from $9k to $12K. This suggests that shorts were piling on while BTC was trending lower from June to July 2020. The liquidation of 27,914 BTC caused the leverage ratio to fall sharply. The current chart looks very similar as BTC has been trending lower with a leverage ratio that’s slowly trending higher and remains elevated.
It is possible for shorts to be stacking up, and this could lead to a short squeeze. It might be one of the many possible catalysts for a breakout to a new all-time high.
In Conclusion
It’s very important to watch the Fed’s commentary closely this week. It’s possible that the initial reaction could be negative, causing a short-term sell-off in risk assets.
Given the bullish trend in fundamentals and on-chain, however, a pullback would be a solid buying opportunity. The bulls have protected the $60K level well, and if it continues to hold, breaking above $63.7K will be a bullish signal of a potential breakout.
Binance Futures 50 USDT FREE Voucher: Use this link to register & get 10% off fees and 50 USDT when trading 500 USDT (limited offer).
PrimeXBT Special Offer: Use this link to register & enter POTATO50 code to get 50% free bonus on any deposit up to 1 BTC.
Disclaimer: Information found on CryptoPotato is those of writers quoted. It does not represent the opinions of CryptoPotato on whether to buy, sell, or hold any investments. You are advised to conduct your own research before making any investment decisions. Use provided information at your own risk. See Disclaimer for more information.
Cryptocurrency charts by TradingView.