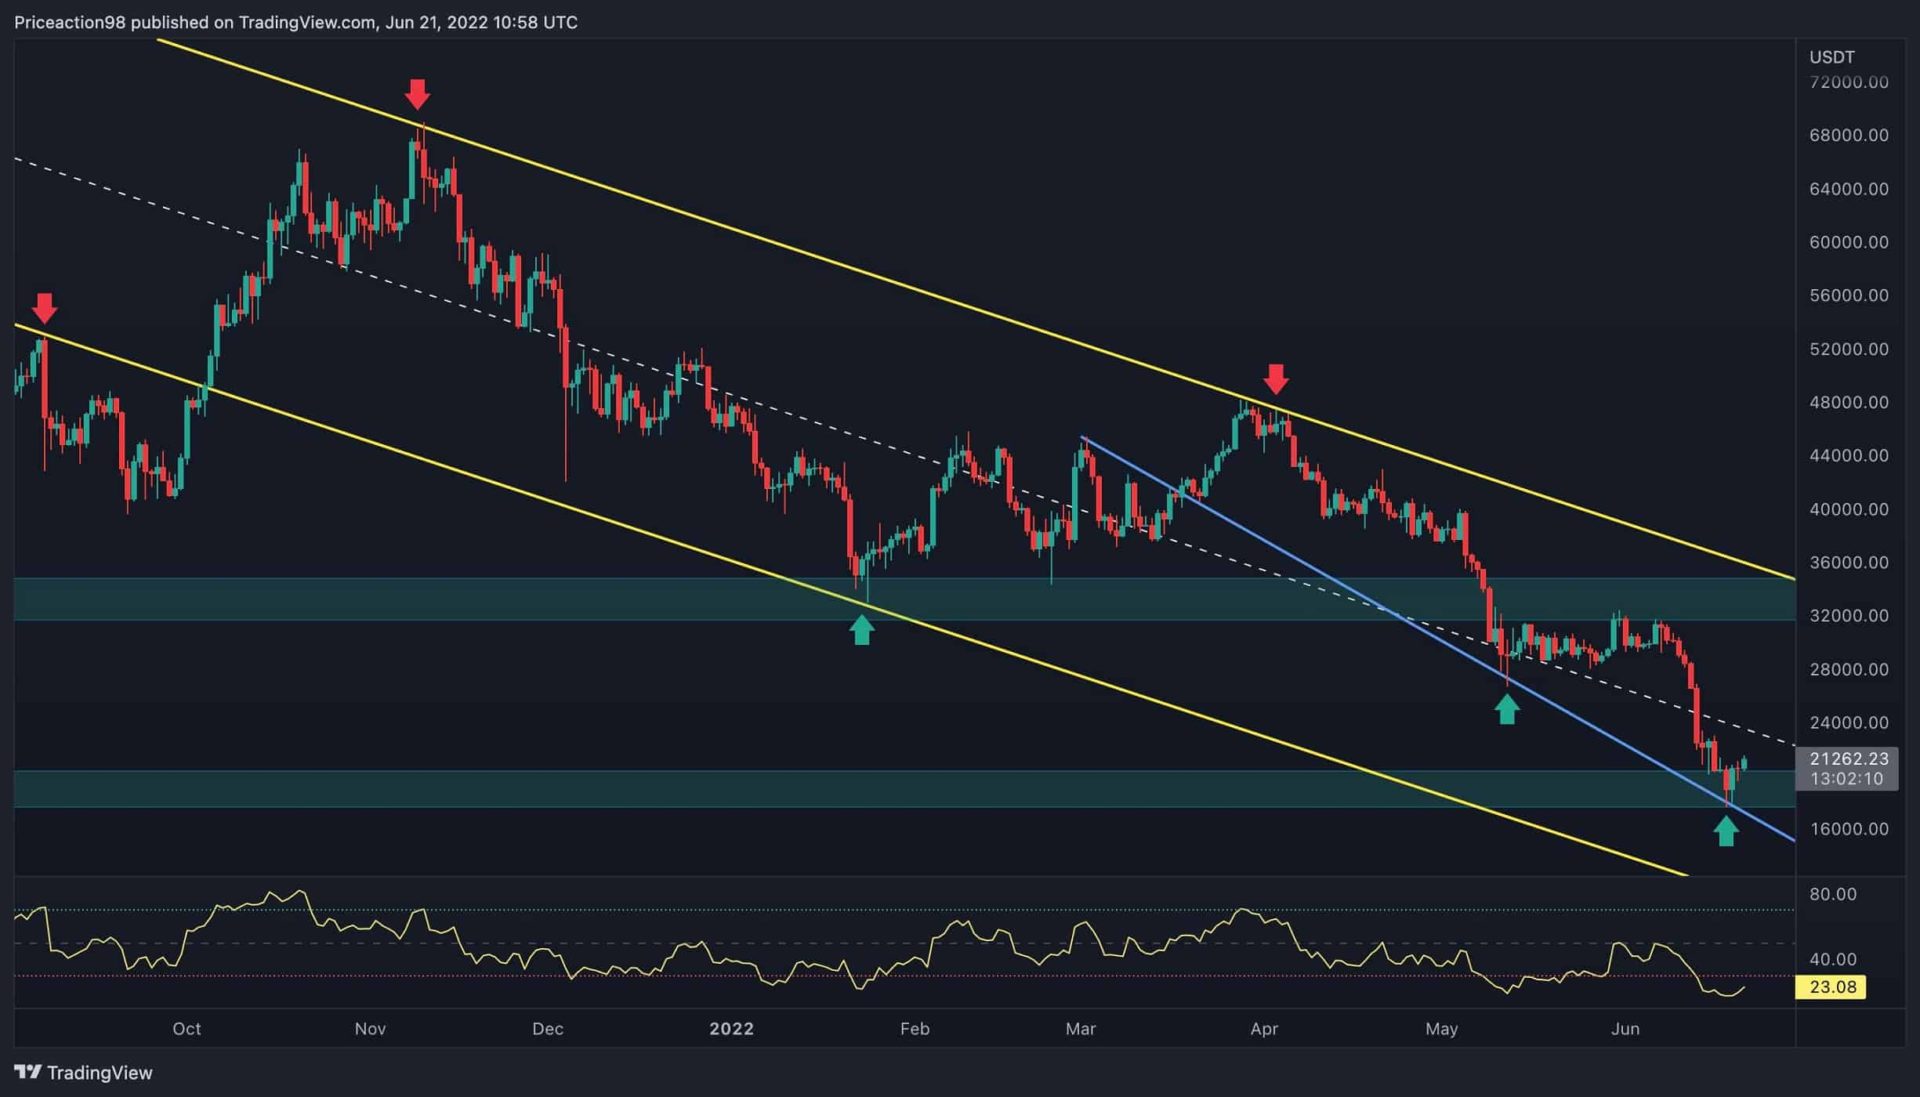
Bitcoin’s price has been falling inside a clear bearish descending channel. The cryptocurrency has been rejected by the upper trendline twice and is now consolidating below the channel’s mid-trendline and the $20K crucial support level.
Technical Analysis
By Shayan
The Daily Chart
The market usually enters a correction/consolidation phase after experiencing an expansion move. Currently, the price has experienced a steep drop and seems likely to enter a range stage in the short term. The $20K level is the most essential and decisive support region for BTC as it is the prior cycle’s all-time high, and the cryptocurrency had never dropped below its previous ATH before.
On the other hand, the blue trendline has been serving as mid-term support for cryptocurrency’s price and has recently defended it from plunging further. However, the channel’s mid-trendline and the 50-day moving average are the primary resistances to the price.
The 4-Hour Chart
Bitcoin has been plummeting inside a bearish descending channel in the 4-hour timeframe as well. The upper trendline has been rejecting the price many times. On the other hand, the lower boundary of the channel, which has supported BTC in the last few weeks, provided a solid foundation for the recent rebound.
Currently, the price has reached the channel’s mid-trendline, which is the main barrier for Bitcoin on the 4-hour timeframe alongside the channel’s upper trendline. Either the price will break this level and rally to the upper boundary, or it will get rejected and attempt to break the lower trendline and the $18K significant support.
Onchain Analysis
By Shayan
Examining the aggregate sentiment of market participants helps in analyzing the ongoing trends. When big players reach the ‘distribution phase,’ they start selling their assets and realizing their profits, a bullish cycle usually ends.
Meanwhile, retailers are suffering from FOMO and are providing the demand side of the market. On the other hand, a bearish cycle often ends when big players join the ‘accumulation phase,’ where they begin buying coins from weak hands at a discount.
During this market stage, known as the “Capitulation phase,” small players typically panic-sell their assets and experience significant losses while the smart money accumulates.
The NUPL metric, which indicates the overall amount of profit/loss as a ratio, is shown in the chart. Due to a significant decrease in Bitcoin’s price below $20K for the first time since the Covid crash, the measure has dipped to the blue range (= -0.099). The market has historically witnessed major capitulation when this metric falls into the blue range, initiating the next bullish cycle.
Binance Free $100 (Exclusive): Use this link to register and receive $100 free and 10% off fees on Binance Futures first month (terms).
PrimeXBT Special Offer: Use this link to register & enter POTATO50 code to receive up to $7,000 on your deposits.
Disclaimer: Information found on CryptoPotato is those of writers quoted. It does not represent the opinions of CryptoPotato on whether to buy, sell, or hold any investments. You are advised to conduct your own research before making any investment decisions. Use provided information at your own risk. See Disclaimer for more information.
Cryptocurrency charts by TradingView.


