
Polkadot’s recent price action has been characterized by steady but uncertain movements within a defined range, highlighting a balance between buyers and sellers.
However, a decisive breakout from this range is imperative to determine its future trajectory.
Technical Analysis
By Shayan
The Daily Chart
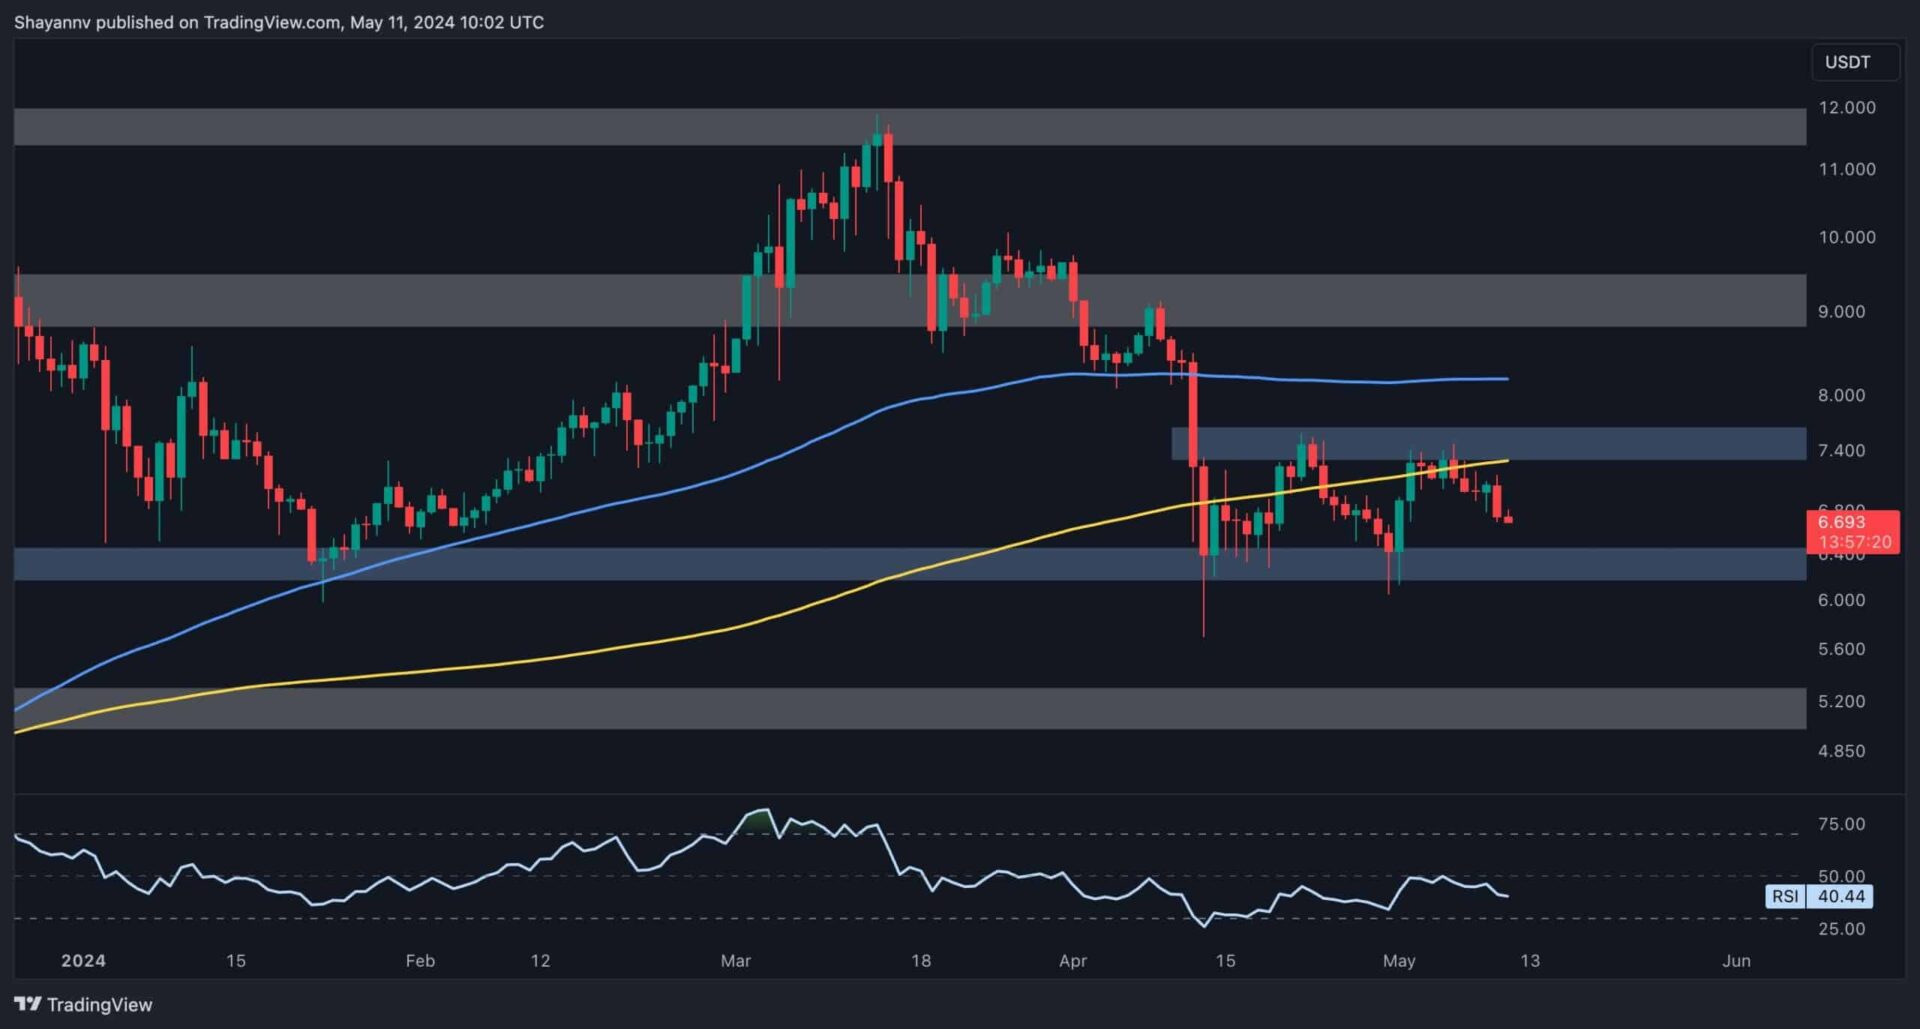
On the daily chart, Polkadot has been trapped within a defined range, with the $6 support and the $7.5 resistance serving as significant boundaries. This sideways movement indicates a period of consolidation, during which buyers and sellers are evenly matched, leading to uncertainty about the cryptocurrency’s next move.
Although there was a bullish rebound towards the upper boundary of the range, which coincided with the 200-day moving average, selling pressure emerged, resulting in a rejection.
This suggests that the price is likely to continue declining towards the lower boundary of the range in the short term. Nevertheless, a breakout from this range is needed to provide clarity on Polkadot’s future prospects.

The 4-Hour Chart
Examining the 4-hour timeframe, Polkadot has formed an ascending wedge pattern following a period of sideways consolidation between the key $6 support level and the significant resistance marked by the 0.5 Fibonacci level at $7.5.
This development has raised concerns about the continuation of the preceding bearish trend if the lower threshold of the wedge is breached.
As a result, intensified selling pressure has been observed near the crucial resistance level of $7.5, leading to a bearish reversal, with the lower trendline of the wedge serving as the next target. Should sellers succeed in breaking this critical dynamic support, a resumption of the initial bearish trend becomes increasingly likely. Conversely, if demand strengthens, continued sideways consolidation appears to be the most probable scenario.
Sentiment Analysis
By Shayan
Understanding the perpetual futures market dynamics is crucial for grasping short-term price movements in cryptocurrencies like DOT. Liquidation events in this market often drive significant price shifts, particularly after periods of consolidation. Visualizing potential liquidity zones can offer valuable insights into where these events might occur.
The provided Binance DOT/USDT heatmap illustrates levels where large-scale liquidations could transpire. The likelihood of a liquidation cascade increases when the price approaches areas marked in yellow. Currently, a notable liquidity pool is observed above the $7.5 level. If the price reaches this region, it could trigger a significant liquidation event, leading to a rapid downturn.
As a result, following the ongoing consolidation phase, the price might experience a short-term pullback toward this level. However, for longer-term projections, it’s essential to analyze how the price reacts to this zone carefully. Market dynamics can shift rapidly, and nothing is guaranteed at this juncture.
Binance Free $600 (CryptoPotato Exclusive): Use this link to register a new account and receive $600 exclusive welcome offer on Binance (full details).
LIMITED OFFER 2024 for CryptoPotato readers at Bybit: Use this link to register and open a $500 BTC-USDT position on Bybit Exchange for free!
Disclaimer: Information found on CryptoPotato is those of writers quoted. It does not represent the opinions of CryptoPotato on whether to buy, sell, or hold any investments. You are advised to conduct your own research before making any investment decisions. Use provided information at your own risk. See Disclaimer for more information.
Cryptocurrency charts by TradingView.