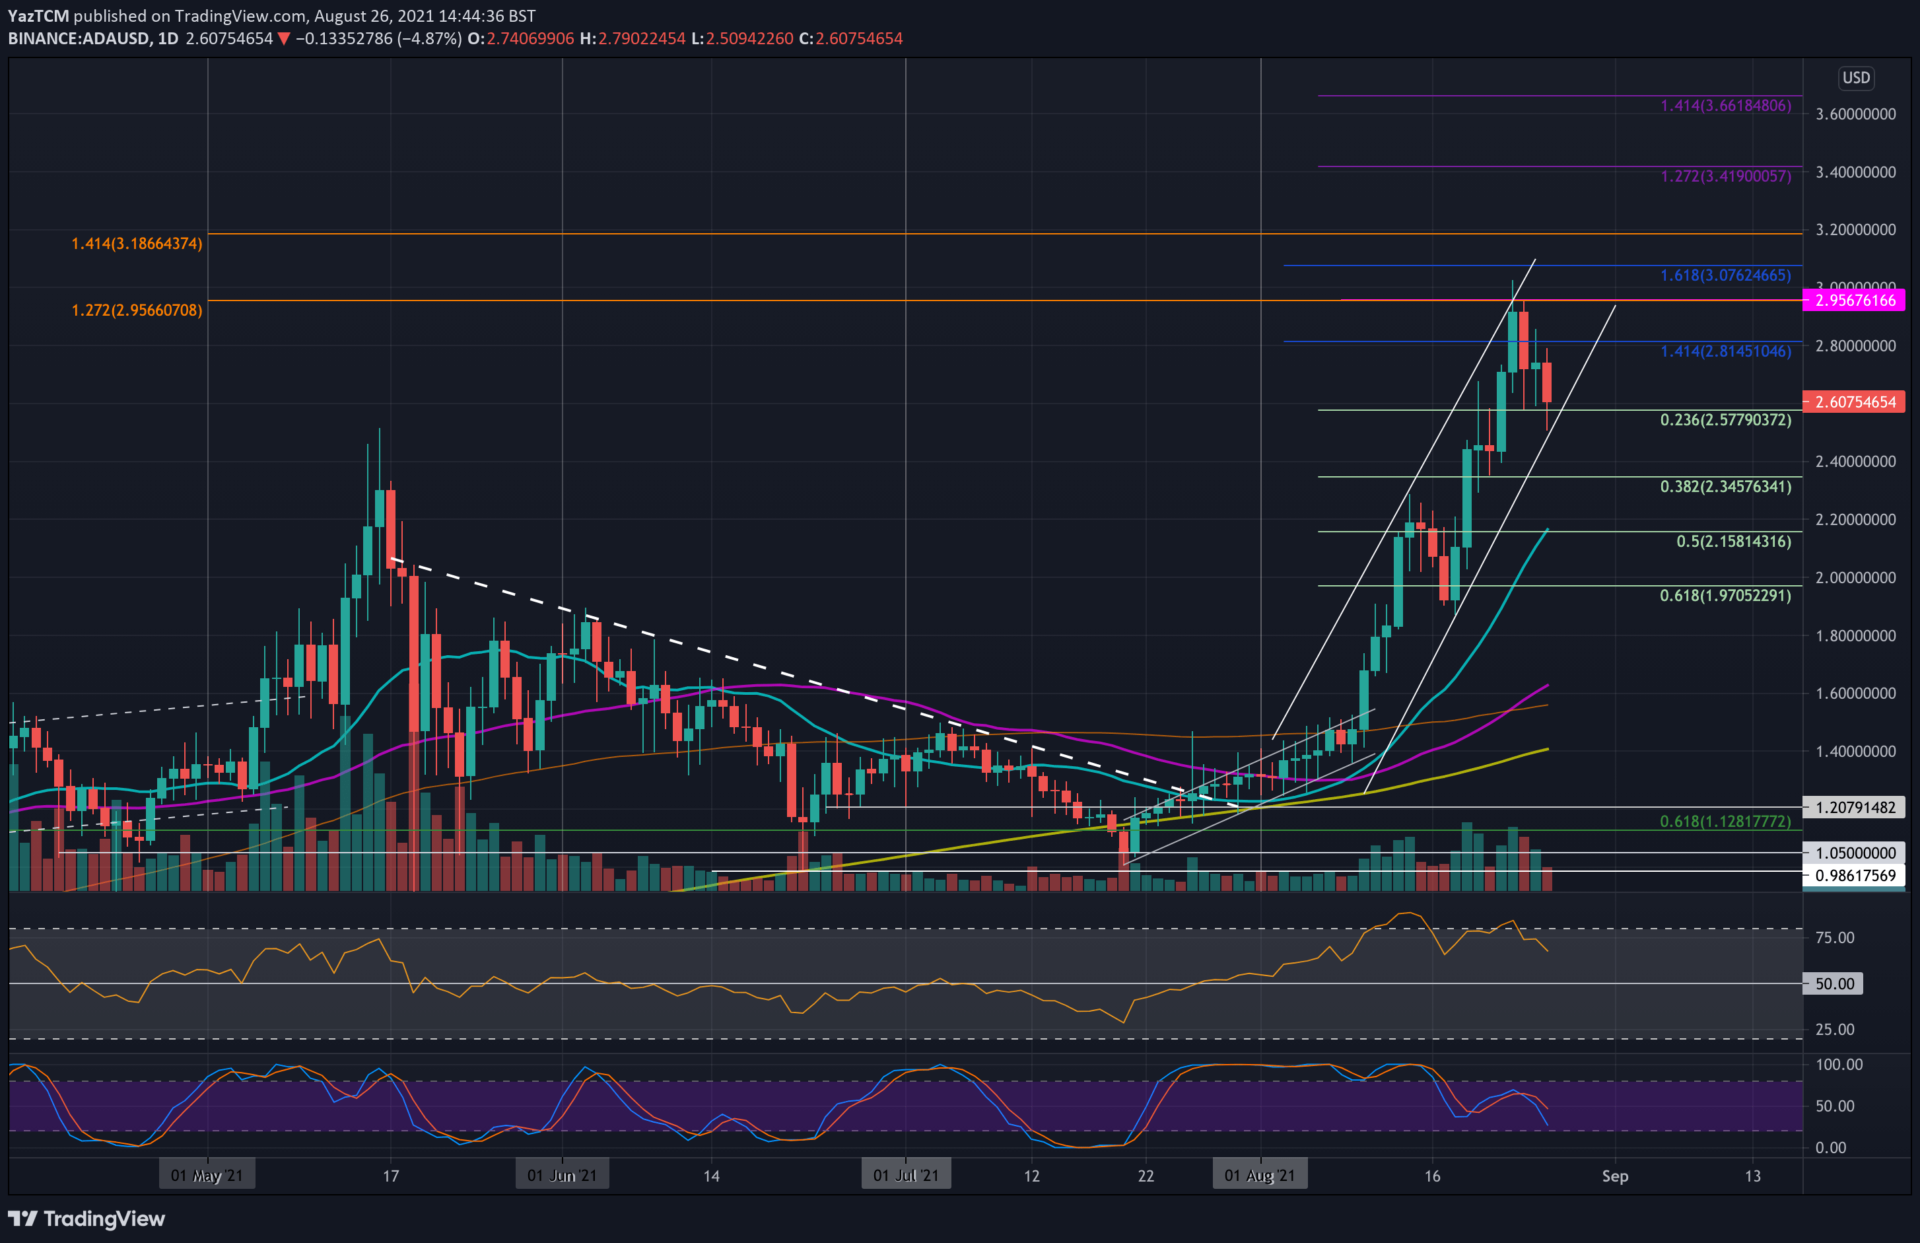
ADA/USD – ADA Rejected From ATH
Key Support Levels: $2.57 – $2.50, $2.35, $2.15.
Key Resistance Levels: $2.80, $2.95, $3.07.
ADA set a new ATH price above $3 on Monday, after soaring from $1.30 (50-day MA) at the start of August. The cryptocurrency surged inside an ascending price channel, and the market found resistance upon the upper boundary of the price channel after setting the ATH at almost $3, according to CoinGecko.
Together with the market retracement, ADA had also pulled back sharply over the past few days but so far – maintains the support at the lower boundary of the above-mentioned price channel, following a retest of the $2.5 support area earlier today. This is also where lies the .236 Fib Retracement support ($2.57).
ADA-USD Short Term Price Prediction
Looking ahead, the first support lies between $2.57 (.236 Fib) and $2.50 (lower angle of price channel). This is followed by $2.35 (.382 Fib), $2.15 (.5 Fib & 20-day MA), and $2.00 (.618 Fib).
On the other side, the first resistance lies at $2.80 (1.414 Fib Extension). This is followed by $2.95 (ATH area), $3.07 (1.618 Fib Extension – blue), $3.20, and $3.42 (1.272 Fib Extension – purple).
The RSI started to head lower as it retraces from overbought conditions. It still remains in the bullish favor, but the downturn suggests the bullish momentum is starting to fade.
ADA/BTC – Remains Inside The Ascending Price Channel.
Key Support Levels: 5325 SAT, 5000 SAT, 4580 SAT.
Key Resistance Levels: 6000 SAT, 6200 SAT, 6300 SAT.
ADA is also trading inside an ascending price channel against BTC since it rebounded from 3200 SAT at the start of the month. The price channel allowed ADA to set a new ATH against BTC at 6000 SAT at the start of the week, but has since pulled back from there as it retraces.
The market is now using the support around 5500 SAT as support, which is provided by the lower angle of the steep ascending price channel.
ADA-BTC Short Term Price Prediction
Moving forward, if the sellers break beneath the channel, the first support lies at 5325 SAT (.236 Fib). This is followed by support at 5000 SAT (.382 Fib), 4580 SAT (.5 Fib & 20-day MA), and 4240 SAT (.618 Fib).
On the other side, the first resistance lies at 6000 SAT. This is followed by 6200 SAT (1.414 Fib Extension), 6300 SAT (1.272 Fib Extension – purple), 6540 SAT (1.414 Fib Extension), and 7000 SAT.
Again, just as the ADA/USD pair, the daily RSI is starting to head lower, indicating the bulls are taking a break to recover as the bullish momentum slowly fades.
Binance Futures 50 USDT FREE Voucher: Use this link to register & get 10% off fees and 50 USDT when trading 500 USDT (limited offer).
PrimeXBT Special Offer: Use this link to register & enter POTATO50 code to get 50% free bonus on any deposit up to 1 BTC.
Disclaimer: Information found on CryptoPotato is those of writers quoted. It does not represent the opinions of CryptoPotato on whether to buy, sell, or hold any investments. You are advised to conduct your own research before making any investment decisions. Use provided information at your own risk. See Disclaimer for more information.
Cryptocurrency charts by TradingView.


