

With bitcoin price up around 70% over the last five weeks, Bitcoin’s “coin days destroyed” metric isn’t reacting as normal.
The below is from a recent edition of the Deep Dive, Bitcoin Magazine‘s premium markets newsletter. To be among the first to receive these insights and other on-chain bitcoin market analysis straight to your inbox, subscribe now.

The topic of today’s Daily Dive will be coin days destroyed, and examining the recent trends surrounding this metric. The metric “coin days” was first brought up as “bitcoindays destroyed” by Bytecoin on the forum BitcoinTalk back in 2011.
“Coin days” refers to the total number of days that a coin has remained dormant. If one bitcoin has not moved in exactly one year, then that coin would have accumulated 365 coin days. Similarly, if 365 bitcoin last moved one day ago, this would also be worth 365 coin days.
Thus, when looking at coin days destroyed, the metric takes all of the individual coins (technically: UTXOs) that moved during a given day and multiplies it by how many days those coins previously remained dormant. In aggregate, this number gives us coin days destroyed for a given day. Looking at this metric can give one a sense of the activity of older investors, and whether bitcoin being transacted across the network are from new or old holders.
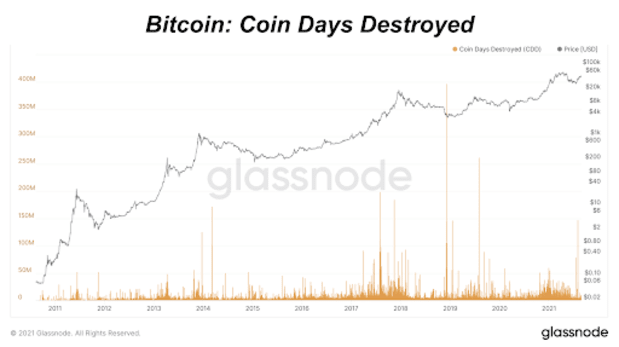
Looking at coin days destroyed alone is not particularly useful as the day-to-day data is clouded by large outliers, but for the sake of context, below is the daily chart of coin days destroyed throughout the history of bitcoin:
Bitcoin: Coin Days Destroyed
Bitcoin: Coin Days Destroyed (7-Day Moving Average)
When applying a seven-day moving average to the data, the data still isn’t very useful, but trends become increasingly visible. When using coin days destroyed data, applying moving averages with longer time frames gives investors a more clear look into investor/HODLer trends.
Throughout the history of bitcoin, large parabolic advances in price are met with large spikes in coin days destroyed as (rightfully so) investors realize some gains on their investment. The top of the 2013, 2017, and most recently 2021 saw large amounts of coin days destroyed, and this can be seen quite clearly below:
Bitcoin: 90 Days Coin Days Destroyed
When looking at the 90-day rolling sum (different from moving average) of coin days destroyed, clear trends emerge over the history of bitcoin.
Interestingly enough however, is that unlike other bull runs that saw a blow-off top, the steep downtrend in 90-days coin days destroyed that followed the large spike in the metric and the local price top, we have seen price respond in a meaningful way, currently up around 70% over the last five weeks, yet the 90 days coin days destroyed metric continues to decline to near five-year lows.