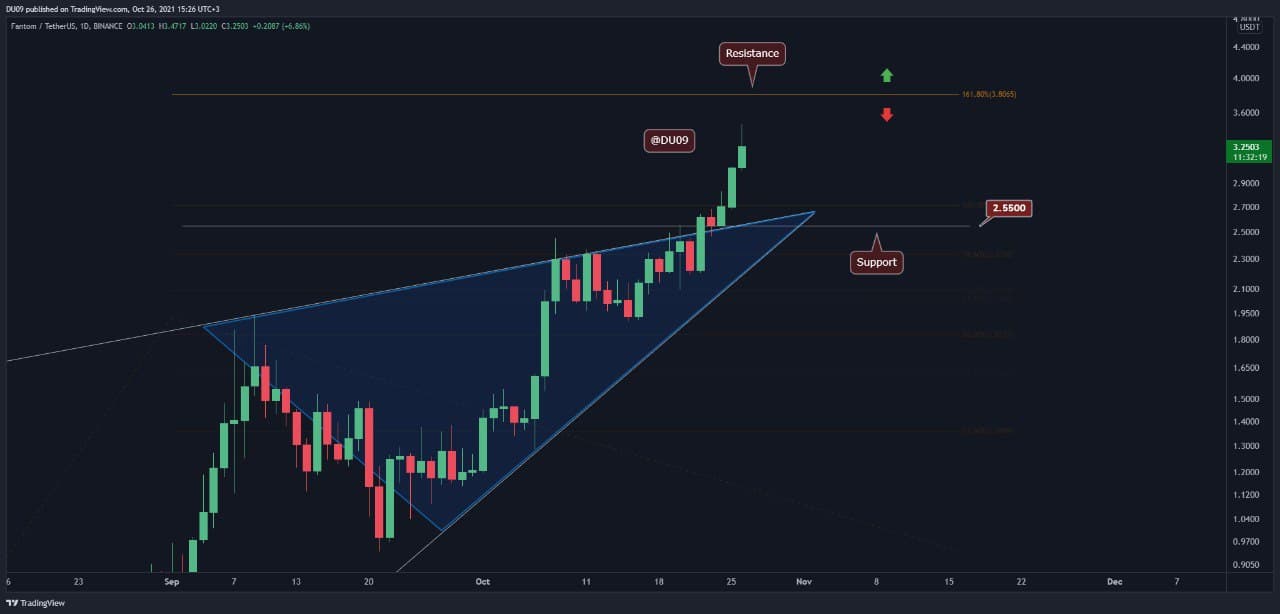
Key Support level: $2.55
Key Resistance level: $3.8
Fantom (FTM) has been setting a new all-time high every day for the past week. This bullish momentum is now accelerating.
Fantom has been long considered an undervalued token in the Decentralized Finance (DeFI) space. However, the bulls are currently in the process of changing this. Fantom-based decentralized exchanges have seen sustained trading volume, which always hinted at FTM’s great potential.
After breaking the resistance at $2.55, the FTM price quickly turned it into support and rallied towards $3.4 at the time of this post. The next resistance level sits just under $4 at around $3.8 based on the Fibonacci extensions. Resistance in this area is expected.
FTM Price Technical Indicators
Trading Volume: The volume on this rally is relatively low compared to the past, with a lower high in the past three daily candles. This is not ideal for the bulls, but the price has nevertheless continued its increase.
RSI: The RSI is above 70 points and clearly placed on the overbought side. This is not a sign of weakness, but strength, particularly when the RSI crosses into the overbought section of the indicator. It’s expected to remain in this area for some time.
MACD: MACD is extremely bullish with expanding moving averages and a bullish histogram which is making higher highs. Look for signs of weakness on the 4-hour timeframe and below to anticipate any possible pullbacks in this rally.
Bias
Bullish. As we approach the $3.8 resistance, profit-taking is going to take place, which will put pressure on further price increases. The trading volume has to pick up if the bulls are to take FTM beyond the $4 level.
Short-Term Price Prediction for Fantom
Considering FTM is in a full rally right now, further gains look like the most probable outcome. The coin may not see any significant resistance until it approaches the $4 level. Therefore, it’s important to keep a close eye on the price action and lower time frames as FTM approaches the first resistance at $3.8. The bulls need to show strength as the price goes up. Otherwise, the bears may take advantage and push FTM in a correction after such a rally.
Binance Futures 50 USDT FREE Voucher: Use this link to register & get 10% off fees and 50 USDT when trading 500 USDT (limited offer).
PrimeXBT Special Offer: Use this link to register & enter POTATO50 code to get 50% free bonus on any deposit up to 1 BTC.
Disclaimer: Information found on CryptoPotato is those of writers quoted. It does not represent the opinions of CryptoPotato on whether to buy, sell, or hold any investments. You are advised to conduct your own research before making any investment decisions. Use provided information at your own risk. See Disclaimer for more information.
Cryptocurrency charts by TradingView.


