

The cryptocurrency market finally saw some relief. Although XRP has experienced a continuous downward trend for three months, it seems that buyers are gradually entering the market. Given the broader market conditions, however, it might be too early to make long-term conclusions.

Technical Analysis
By Grizzly
The Daily Chart
On the daily timeframe, XRP is entering its second week of trading on the horizontal support at $0.3. This level comprises a combination of the intersection of two descending lines (in white) at $0.29 that have been with the price for more than a year. The 30D RSI indicator also went close to the oversold zone, the lowest level since April 2018.
Due to the continuous downward trend that the price has experienced, temporary relief rallies are somewhat expected. Technically, as long as the cryptocurrency does not form a higher high and low, a bullish trend remains in low probability. To counter this, XRP must be able to return above $0.5 again, and buyers must consolidate above this level. The descending line (in red) in the RSI can also be considered a considerable resistance. This indicator is now in the bearish area. If it can reach above the baseline or zero, then perhaps the bulls might be able to step up.
Key Support Levels: $0.30 & $0.24 & $0.17
Key Resistance Levels: $0.44 & $0.58
Moving Averages:
MA20: $0.36
MA50: $0.42
MA100: $0.59
MA200: $0.68
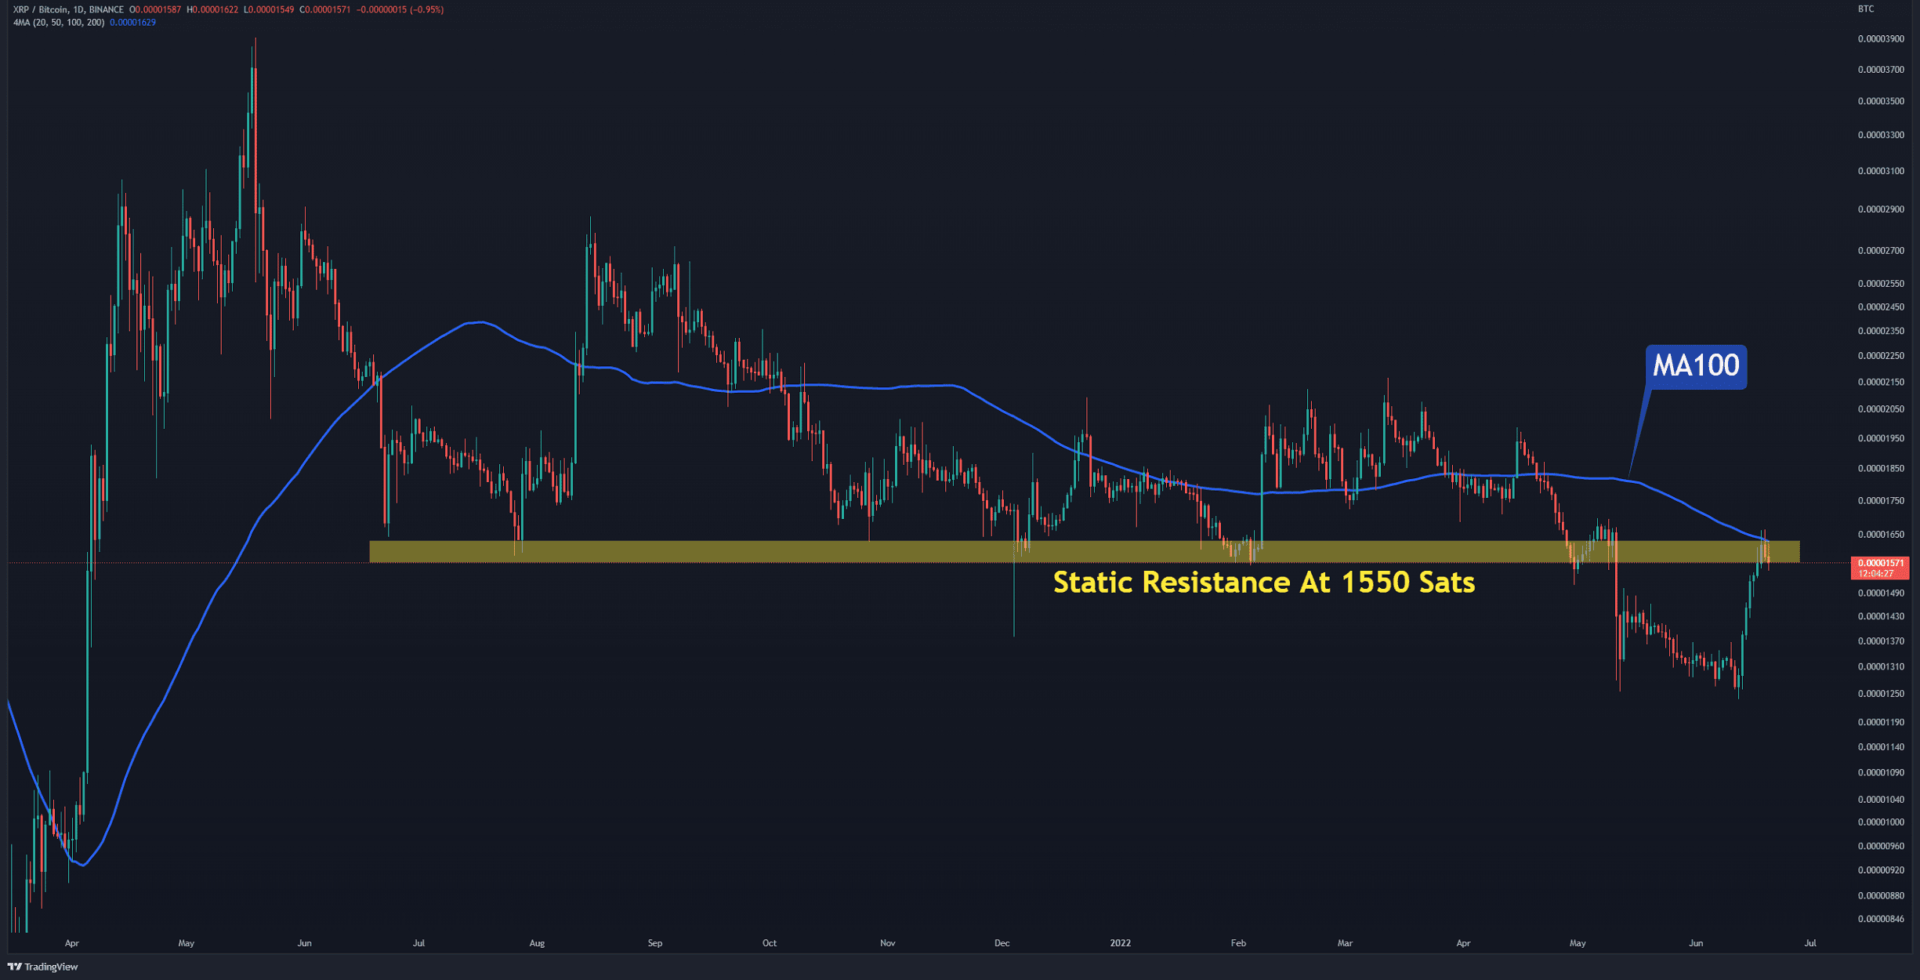
The XRP/BTC Chart
In the BTC pair chart, the bullish movement paused when the price reached the horizontal resistance at 1550 Sats (in yellow). This level also intersects with the daily MA100 (in blue), which has increased its disincentive power. The bulls need to overcome this barrier to keep their dominance. Pushing the price above it and then breaking the resistance at 1700 Sats could increase the momentum.
Key Support Levels: 1250 Sats & 1100 Sats
Key Resistance Levels: 1550 Sats & 1700 Sat
Binance Free $100 (Exclusive): Use this link to register and receive $100 free and 10% off fees on Binance Futures first month (terms).
PrimeXBT Special Offer: Use this link to register & enter POTATO50 code to receive up to $7,000 on your deposits.
Disclaimer: Information found on CryptoPotato is those of writers quoted. It does not represent the opinions of CryptoPotato on whether to buy, sell, or hold any investments. You are advised to conduct your own research before making any investment decisions. Use provided information at your own risk. See Disclaimer for more information.
Cryptocurrency charts by TradingView.